There are no safety hazards associated with this method. However, cleaning and sanitization of surfaces between panelists should be conducted to prevent the spread of bacteria and viruses. Furthermore, although not directly related to this method, glassware cleaning chemicals could have hazards associated with them. Before use of any cleaning product, refer to the manufacturer's Safety Data Sheet (SDS) to review hazards, and handling and disposal procedures.
As beer sits in the package over time, various chemical reactions, such as oxidation, occur. Desirable flavor compounds (like esters and alcohols) diminish as undesirable ones, such as trans-2-nonenal (T2N) and ß-damascenone, begin to increase in concentration, causing a negative flavor change, or staling, of a beer’s fresh sensory profile.
The goal of shelf life testing is to simulate how packaged beer staling will occur sensorially after aging for certain periods of time/temperature under optimal conditions (i.e. kept at refrigeration temperatures) and suboptimal conditions (i.e. non-refrigerated temperatures, similar to that of beer stored in a warehouse or distribution center) (Figure 1).
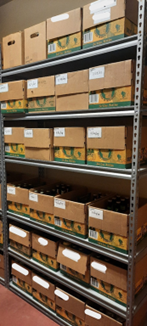
Figure 1: Beverage library labeled by date of panel testing
Sample Collection and Assessment Schecule
- Conduct shelf life testing as a separate panel from product release, preferably with off-taste sensitive panelists.
- Overcome recognition bias in panelists by including blinded fresh samples during shelf life testing and providing training and testing of panelist routinely.
- Collect enough samples for sensory testing and store in a location that simulates warm-storage conditions. This may be a different location than your primary Beverage utilizing to the same guidelines, except temperature.
Sample Treatment (Beverage Library)
- Refer to Maintaining a Beverage Library Best Practices for more details regarding logging the storage information.
Sample Treatment
- Beer for shelf life testing is kept under suboptimal storage conditions, meaning that it will follow the same conditions spelled out in the Maintaining a Beverage Library Best Practices document, except that the temperature will be elevated to a range reflecting room temperature condition, mimicking “real world conditions” that most beer in market is subjected to. The recommended temperature range is 73-77 °F.
- Remove beer samples from warm storage and refrigerate prior to sensory panel for at least 24 hours.
- For suboptimal storage condition testing, the temperature should be typical room temperature but not hot to force age samples.
- Keep additional samples stored chilled to evaluate at the same time as the aged samples. The chilled samples should be used as a reference. The chilled sample results will not be used in determining shelf life but as a reference to see how the product has quickly aged over time when stored in ambient conditions.
Ballot Design and Data Collection
- Instruct panelists to be as descriptive as possible in accepting or rejecting a beer in shelf life studies.
- Comments on color, aroma and bitterness and other flavor related chemistries are important data points, for supportive sensory consensus.
Interpretation of Results
- Compile results in a table to track how different batches and different brands are faring with age (Table 1).
- Analytical data such as final gravity, pH, % alcohol, and microbiological data are helpful to include. Deviations in these analytics could explain sensory outcomes seen in taste panel.
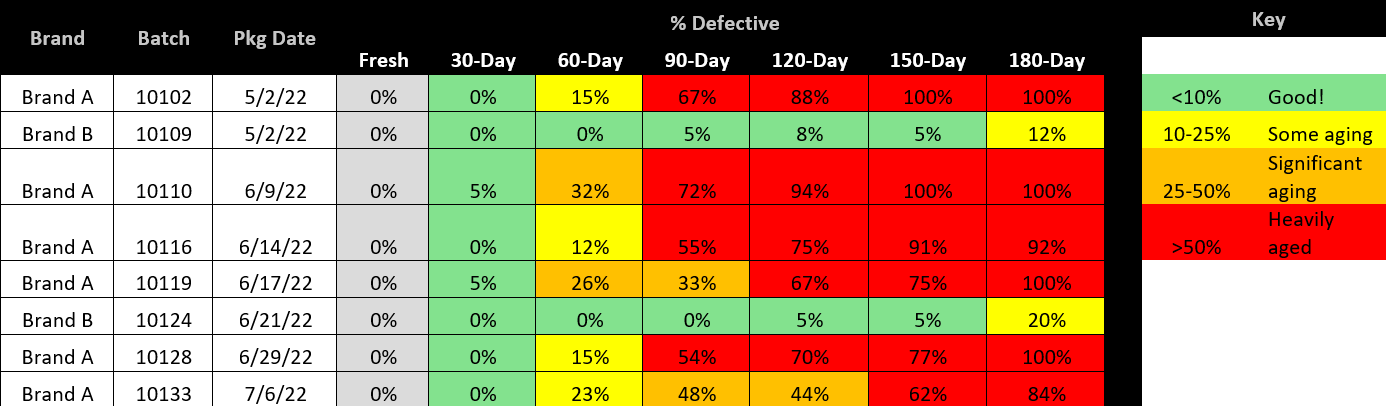
Table 1. Example of tabulated shelf life data using color conditioning. Results here show shelf life of Brand A falls between 60 and 90 days, whereas Brand B’s shelf life is at least 180 days.
(Note: If you “sort” your Table 1 by Brand A and Brand B, and include a running average “row” at the bottom for each brand, it would be easier to determine real time staling)
- Record generic and concise descriptions from panelist for reference when determining shelf life (lipstick = papery, basement = musty, etc.) The goal is to understand what flavors commonly develop in each brand as it ages and why it fails the TTB test (Table 2). Also, by doing this logging of flavors, you are creating a “Descriptive Profile” of each brand, which may be related to hop varieties, dry-hopping, etc. caused/preserved staling.
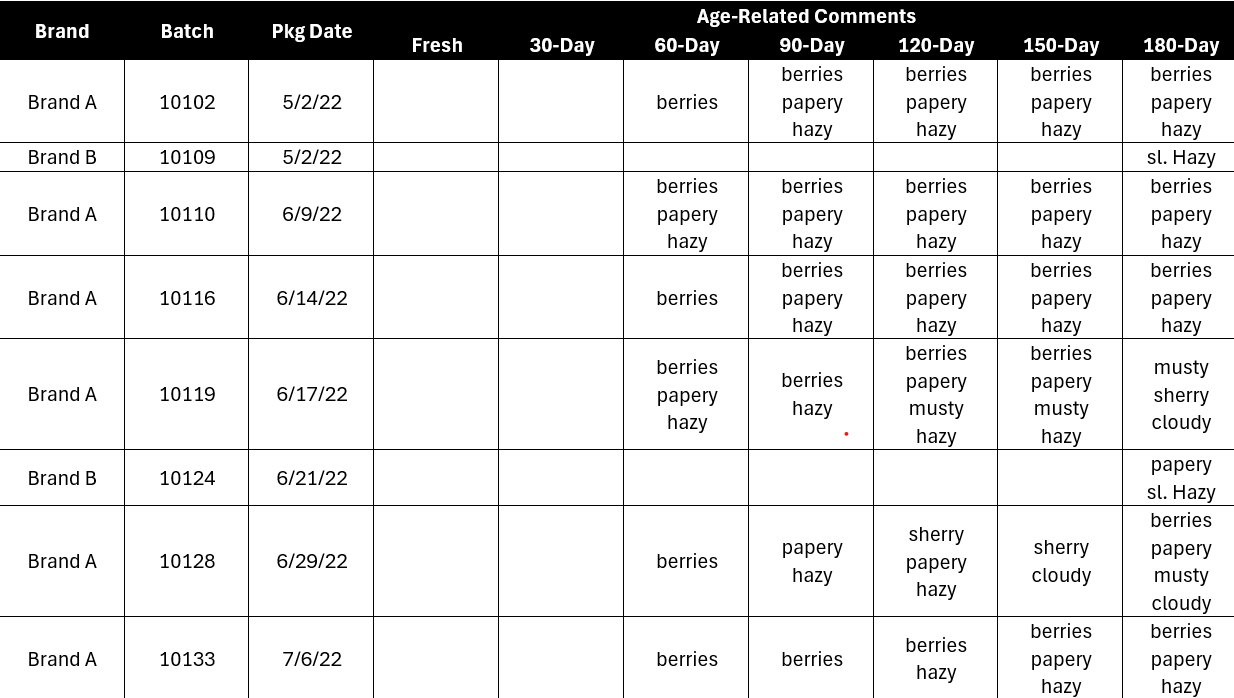
Table 2. Example of concise age description table utilizing the same brands in Table 1.
Big thanks to, J. Harmon, M. Denny, S. Bennett, A. Butler, K. Fromuth (chair)